What’s in Store for the C&I Solar Market?
- 20/03/24
- Business of Solar,Industry News
As the world collectively deals with a particularly turbulent period, the current short-term obstacles shouldn’t hinder long-term goals for businesses. One such long-term goal includes the current historic opportunity to transition to renewable energy sources, such as solar.
While the current global uncertainty might put a small dent in immediate solar demand, most industry analysts expect the market to quickly recover. Solar, especially, should weather the storm better than other renewable energy sectors, according to business intelligence firm Wood Mackenzie. The firm noted how the Asian-dominant supply chains for solar have already started rebounding, which should help the industry maintain full-year growth.
C&I Solar Demand Continues to Grow
A main factor contributing to solar growth in the U.S. and globally is the expansion in commercial and industrial solar.
Of the 22 GW of corporate renewable energy deals announced since 2008, more than 13.5 GW of these deals were announced in 2018 and 2019, according to the Renewable Energy Buyers Alliance (REBA) Corporate Renewable Energy Deal Tracker, 2019. Between 2016 and 2018, C&I solar accounted for 20 percent of total U.S. solar capacity. Further, projections show that just within the Fortune 1000, C&I customers will need up to 85 GW of renewable energy through 2030.
Despite the current situation around the world, long-term demand for C&I solar should remain strong for the foreseeable future.
What States Are Driving C&I Growth?
A key factor in the growth of C&I solar comes from improving statewide policies, regulations and incentives for renewable energy procurement.
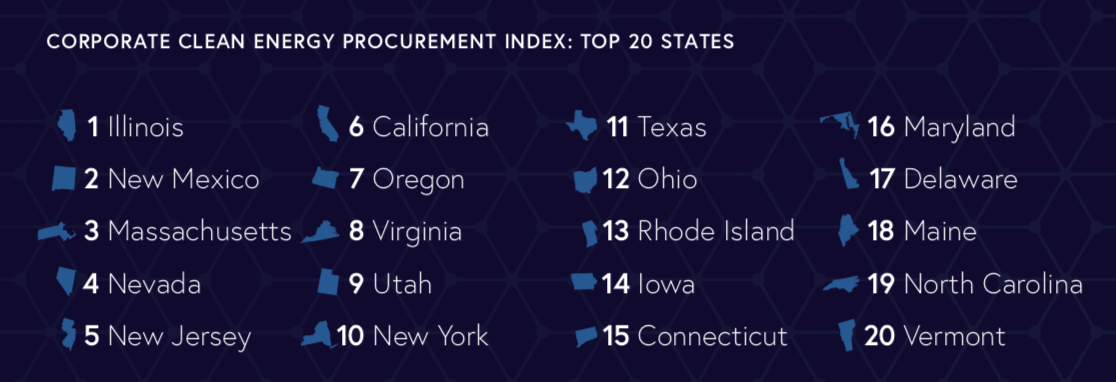
The Retail Industry Leaders Association (RILA) recently released the 2020 update to their Corporate Clean Energy Procurement Index. First started in 2017, this study ranks how easily major companies and brands can procure state-level renewable energy in each of the 50 U.S. states.

(Credit: RILA)
The 2020 Index revealed that Illinois took home the top spot in the rankings, notching a score of 73.6 out of a possible 100. Jumping ahead 22 spots from last year’s Index, New Mexico came in second. Massachusetts ranked third after moving up three spots. Nevada and New Jersey ranked fourth and fifth, respectively. Meanwhile, Iowa, the former top-ranked state, fell to No. 14.
The results highlighted a wide disparity in state-level clean energy policies. This stems from differences in access to renewable energy from third-party developers, procurement options from local utilities and regulations on developing onsite projects at corporate facilities.
Although the Index serves many purposes, it’s become an invaluable resource for companies looking to move their operations to states where they can best leverage increasingly affordable renewable energy sources to power their businesses.
For example, the rankings indicate how favorable the political environment is in each state for developing broad access to renewable energy procurement for companies. This means that the top five states currently offer the best policies and incentives for businesses looking to use renewable energy sources.
The Index also provides guidance for states lagging in favorable renewable energy policies. As shown in the report, those states with common sense clean energy policies increase their chances of attracting new business development. This provides more jobs for the communities while minimizing companies’ carbon footprints.
Although the current state of affairs remains uncertain, the future looks bright for the C&I solar market.
Relevant Topics
Smart Energy Solutions
delivered straight to your inbox

